Because VMs generate logs as part of the operating system – Windows event logs for Windows servers and syslogs for Linux servers – Microsoft provides agents that must be installed on the VMs.
There are four different agents that can be installed on VMs, and each either collects different logs or can send them to different destinations. The newest, the Azure Monitor agent, is in preview at the time of writing; however, it will eventually replace the Log Analytics and Telegraf agents on Windows and Linux. The following diagram shows at a high level how we can use different agents and settings and where we can send those logs and metrics:
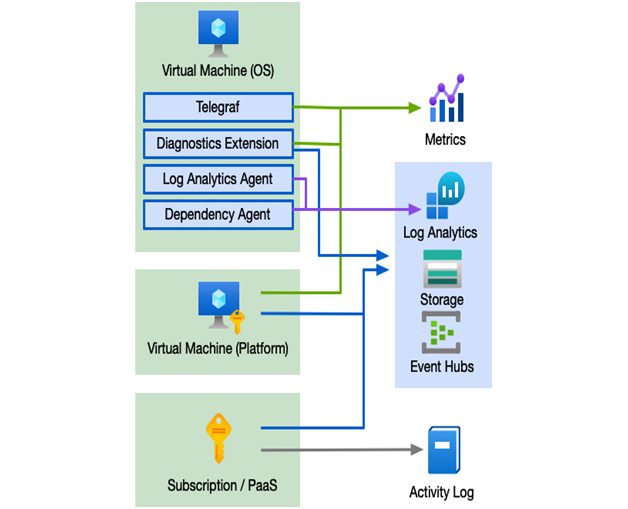
Figure 15.5 – Log sources and destinations
Next, we shall look in more detail at each of the different agents.
Azure Monitor agent
The Azure Monitor agent uses Data Collection Rules (DCRs), which are configured in the Azure Monitor blade. You can create multiple DCRs for different purposes, and each DCR can have its own set of the following:
- Data sources: Define specific performance counters, such as CPU, memory, disk, and network metrics, or event logs, such as application logs, security logs, or system logs.
- Destinations: Sets where logs will be sent, for example, Azure Monitor Metrics or an Azure Log Analytics workspace.
- Resources: The VMs you wish to collect logs from.
Because you can create multiple DCRs, you can set up complex scenarios for different needs. For example, you could have a DCR for all VMs that collects general metrics and logs and another rule for SQL servers that collects SQL-specific metrics and logs.
Log Analytics agent
The Log Analytics agent also collects monitoring data from the operating system of VMs and sends that data to a Log Analytics workspace. The agent is the same agent that is used by System Center Operations Manager (SCOM) and can be used in conjunction with an on-premises SCOM implementation. This also means that the agent can be used to collect logs from on-premises VMs and even VMs running on other cloud platforms.
The Log Analytics agent and its data are used by a number of Azure monitoring tools, including the following:
- Log Analytics
- VM insights
- Azure Automation
- Azure Security Center
- Azure Sentinel
Because the Log Analytics agent only sends the data to a Log Analytics workspace and Azure Monitor, if you need to send information to other sources, such as Azure Storage or Event Hubs, you may need additional agents such as the diagnostics or Telegraf agents.
Azure diagnostics agent
The diagnostics agent can collect performance data, operating system logs, and crash dumps. However, the diagnostics agent sends those logs to an Azure storage account and optionally an event hub or Azure Monitor Metrics. This makes the agent ideal when you need a longer-term storage mechanism without built-in querying capabilities or if you want to send logs to external services by integrating with an event hub.
Important Note
You cannot configure the diagnostics agent to sends logs to an event hub via the portal; this can only be done using PowerShell, the Azure CLI, or via an ARM template.
Another limitation to using the diagnostics agent is that it can only be used on Azure resources.
Telegraf agent
The Telegraf agent is also used to collect performance data; however, it is specifically for Linux computers. The agent can only send data to Azure Monitor Metrics for viewing in the Azure portal via the metrics explorer.
Dependency agent
The dependency agent is an add-on to the Log Analytics agent and is used to collect data about running processes on a VM and track external dependencies on those processes. This agent is used by the VM insights tool or the Service Map solution, which are covered in the next section.
Before we move on to the tools we can use to use our logs, we need to quickly look at the options for deploying the different log options.

Leave a Reply