Using a cloud platform such as Azure provides great flexibility in costs; that is, you only pay for exactly what you need. However, with such a flexible pricing model, costs could easily spiral out of control, resulting in bill shock.
Luckily, Azure provides you with a number of tools to help keep an eye on costs and even recommends changes to your infrastructure if you’re underutilizing any services.
The first of these tools is the Cost analysis blade. Select any subscription in the portal and you have a Cost analysis option under Cost Management. The following screenshot shows an example:
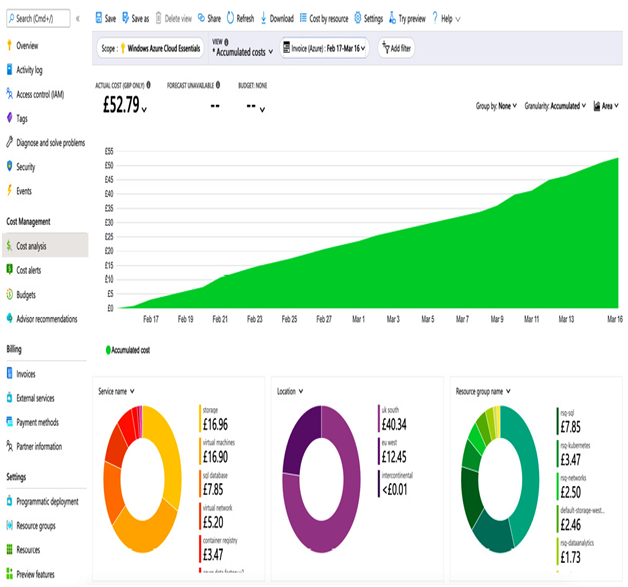
Figure 15.19 – Example cost analysis
The Cost analysis panel enables you to tailor your view to show a range of different options. The default view will show the current spend for your billing period and a prediction, based on currently running services, of how much your final bill will be.
The menu options provide the ability to filter on a range of options, including resource group, resource type, and location. You can also group by these options, change the granularity to accumulated, daily, or monthly, and set the range you wish to report over, for example, current billing period, previous billing period, or last 12 months.
You can also change the visualization itself to show the data as bar charts, line charts, donut charts, or even in tabular format. For example, the following screenshot shows daily spend grouped by location and displayed as a bar chart:
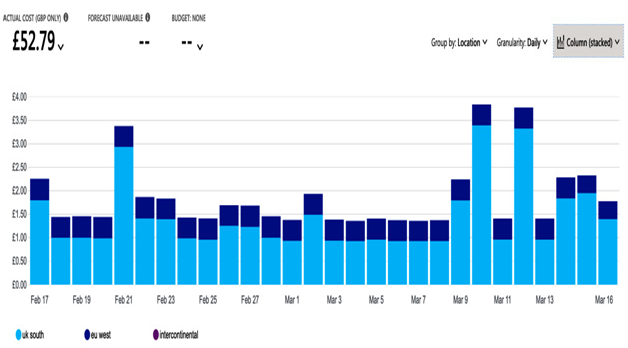
Figure 15.20 – Different cost analysis reports
You can also export your report. This can be performed as a one-off download, either as an image, Excel file, or CSV. Or you can create a regularly scheduled export – daily, weekly, or monthly – and have the report sent to a storage account.
Being able to see your current costs is useful, but sometimes you need to be able to control costs very tightly – for example, if you have a development team that is working on a proof-of-concept solution, you may need to either set a defined monthly budget or at least be alerted if costs go over a particular threshold.
Again, Azure provides the ability to perform both these tasks. From the Cost alerts or Budgets view, you can set a monthly, quarterly, or yearly budget, and then create an alert that will send an email or other notification should a percentage of that budget be reached. For example, you could set a budget of $100 a month with an alert at 80% so that you can be informed when you are getting close to that budget.
Another tool that can be used to help save costs is the Azure Advisor tool. Azure Advisor continually monitors your subscriptions and makes recommendations for security, reliability, operations, performance, and, of course, costs.
The Advisor tool can be viewed any time and is a great way to quickly see areas for improvement. The following screenshot shows an example of what this might look like:
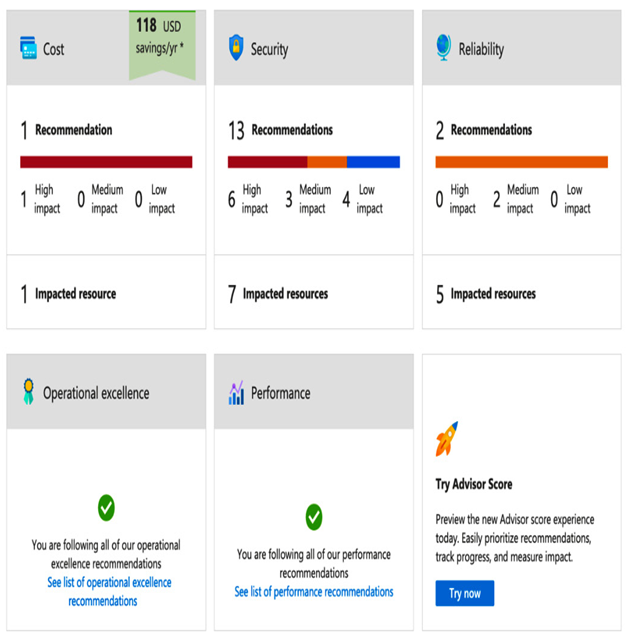
Figure 15.21 – Azure Advisor example
By clicking on one of the areas of improvement, for example, Cost, you are then taken to the details, which you can then action. The following screenshot shows a typical cost-saving option for VMs, which is the ability to save money by opting for reserved instances:
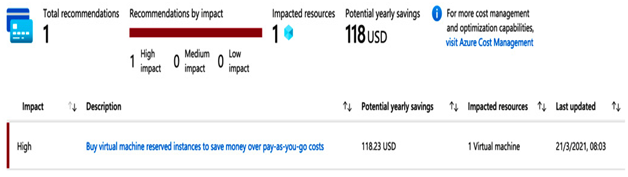
Figure 15.22 – Example cost-savings recommendation
Through a combination of reporting, alerts, and acting on recommendations, you can ensure that your Azure subscriptions are always running optimally, efficiently, and, of course, economically.
Summary
In this chapter, we began Section 5, Operations and Monitoring, by looking at the options available for building robust monitoring and logging solutions.
Azure provides basic capturing of metrics and logs from the platform and its components, including built-in tools for visualizing and exploring them. For more advanced scenarios, we looked at additional options for sending these logs and metrics to other locations, such as storage accounts, Log Analytics workspaces, and event hubs.
We looked at how to also hook into and capture VM operating system logs, and then how we can use tools such as Log Analytics to query across multiple data sources.
We then examined how to use Security Center, Defender, and Sentinel to provide proactive threat detection and remediation, and how each product can work together to enable automation and alerting.
Finally, we looked at the tools available for reporting on and monitoring costs.
In the next chapter, we continue our operations theme by looking at how we can back up our solutions, and what options we have for recovery depending on your business requirements.
Exam scenario
MegaCorp Inc. is a multi-national organization spread across many different divisions, including sales and marketing, HR, and IT. Due to its size and complexity, each division within each country manages its own solutions, which are hosted in Azure, and each division has its own Azure subscription for its applications.
IT and the overall health management is controlled by a central team that has responsibility for all divisions and countries, and as part of this, a separate sub-team is responsible for monitoring and responding to security threats.
The IT team also runs proof-of-concept systems with business areas when developing new solutions, and these are often created as needed and then de-commissioned when no longer in use.
As the lead architect, you must recommend a monitoring and logging solution that addresses the following requirements:
- The security team needs overall visibility of potential threats.
- Over time, the security team wishes to implement automated responses to common threats.
- Individual product teams need to be able to monitor performance and technical issues on their solutions.
- Due to their nature, proof-of-concept solutions need to be tightly controlled from a cost perspective.
Recommend and design a solution that meets the company’s requirements.

Leave a Reply