By default, basic logs and metrics are stored automatically on the platform and you can view up to 30 days of history. These default views also provide basic filtering and monitoring options to get a high-level view of what is happening to your solutions. If you need longer retention of logs or wish to perform deeper analysis or integrate with other services, logs must be directed elsewhere.
At the subscription level, activity and resource logs can additionally be sent to a Log Analytics workspace, an Azure storage account, or an Azure Event Hubs instance. To set up the additional destinations, or sinks, from the Activity Log blade, click Diagnostics Settings followed by +Add diagnostic setting. The following screenshot shows an example of this page:
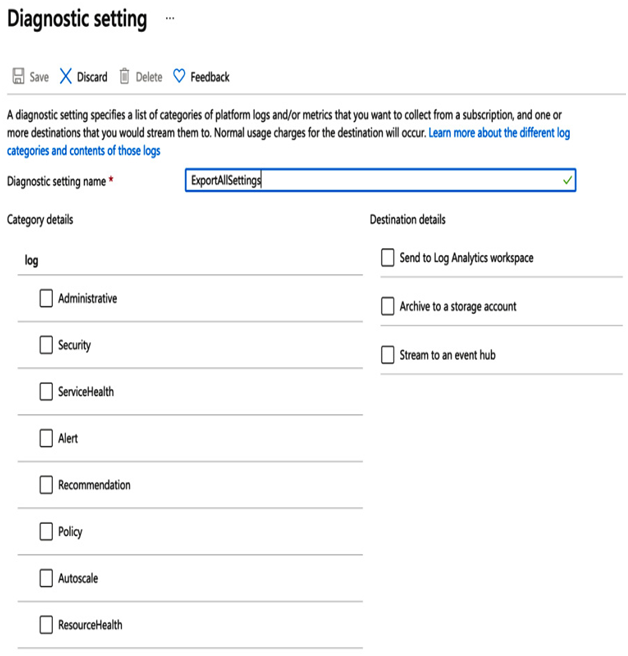
Figure 15.2 – Sending activity logs to additional sinks
For activity logs, setting additional destinations at the subscription level will direct all logs of all components within that subscription. Additional log options can then be set at either the subscription level or the component level; in this way you can configure what logs are sent where at a very granular level.
For example, you could set logs to be sent to a central Log Analytics account at the subscription level, and then create additional sinks at the component level to also send those logs to an application-specific Log Analytics workspace, storage account, or event hub, as we can see in the following example:
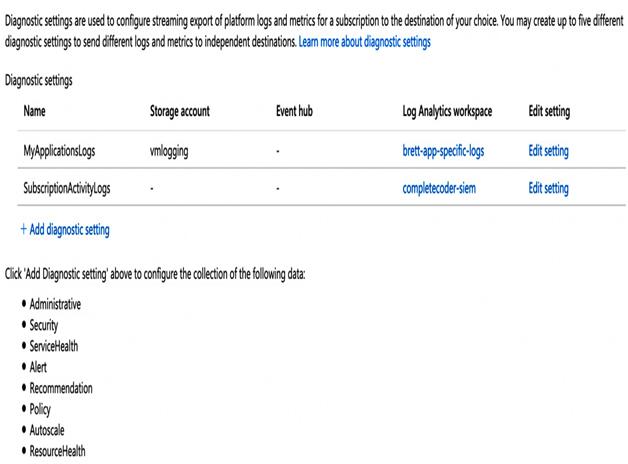
Figure 15.3 – Configuring multiple log sinks
As we saw in Figure 15.1, you can also be selective in the logs you send. Therefore, by configuring specific logs being sent to multiple sinks, you can ensure different teams only receive the logs they are interested in.
Configuring logs from the Activity Log blade allows you to collect the following specific log types:
- Administrative: Creating, updating, deleting, and actioning events, for example, creating a storage account or starting a VM
- Security: Security Center alerts, such as suspicious double extension files executed
- Service health: Region-wide health events
- Alert: Alerts that you can define, for example, if you create an alert to monitor for high CPU usage
- Recommendation: Azure Advisor recommendations
- Policy: Events triggered by policies
- Autoscale: VM scale sets or apps scaling out or in
- Resource health: Resource-specific health issues
Individual services also have their own specific logs. Again, these logs can be directed to a Log Analytics workspace, storage account, or event hub. These additional logs are configured through each component’s diagnostics blade.
In the following screenshot, we can see the diagnostics blade for a SQL database. The view is similar to what we saw when configuring activity logs, and again to output the logs to a different destination, we simply click + Add diagnostic setting and then select the Log Analytics workspace, storage account, or event hub:
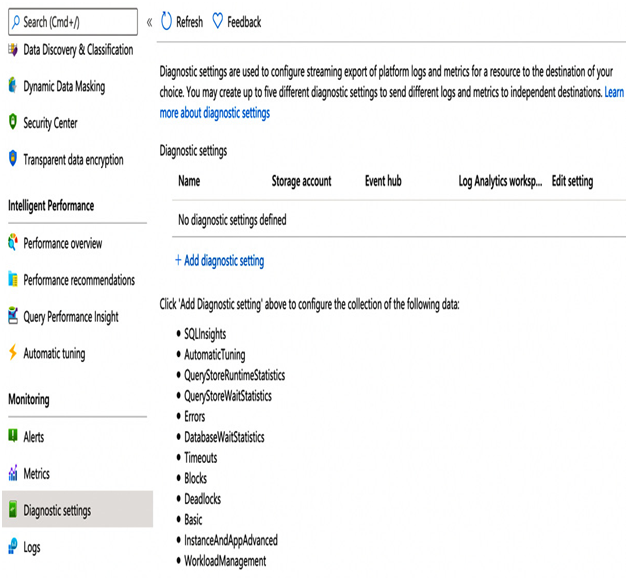
Figure 15.4 – SQL database diagnostics settings
What is different, however, is the logs that are sent; in this example of a SQL database, we see specific options for databases such as SQLInsights, QueryStoreRuntimeStatistics, and DatabaseWaitStatistics.
Again, we can send some or all of these logs to the destination or create multiple settings to have logs sent to multiple sinks for consumption by different teams.
All Azure components emit logs and metrics as described in this section. However, VMs behave differently. Although you can collect Azure management plane events that are still captured through the activity log, a VM can optionally have agents installed to collect additional metrics and logs from the VM.

Leave a Reply