Monitoring data is largely split into two different types – metrics and logs.
Metrics describe an aspect of a system at a particular point in time and are displayed in numerical values. They are capable of supporting near real-time scenarios. Logs are different from metrics. They contain data that is organized into records, with different sets of properties for each type. Data such as events, traces, and performance data is stored as logs.
Metrics and logs can also come from numerous sources; again, these are generally broken down into the following:
- Application: Data gathered from a custom-built application such as .NET applications. Applications must be discretely configured to emit their logs and information to an Application Insights instance.
- Operating system: Windows and Linux operating systems have their own logging mechanisms, and these can be hooked into. You must install the diagnostics extension, Log Analytics agent, or dependency agent on each VM to receive this data.
- Azure resources: All Azure native resources produce their own metrics and logs; however, some must be explicitly captured. This includes VMs when considered from the Azure management plane point of view and are additional to operating system logs. As each resource is different, the types of logs you can receive from them are also different.
- Azure subscription: Also known as the activity log, events on the Azure management plane for an individual subscription are logged. Examples include the health, deployment, interaction, and modification of Azure services.
- Azure tenant: User operations such as the creation, modification, and deletion of users.
- Custom source: Some external services or software installed on a VM may produce their own logs. For example, an application may output data to a CSV file on a VM or via a REST API. This data can be mapped, collected, and reported on in Azure Monitor.
Logs and metrics from each source can be used in a variety of ways, and how you wish to view or interact with them will determine what additional configuration may be required.
Understanding log use cases
Logs can help in a number of different ways; the following are some use cases that will be covered in more detail through this chapter:
- Analysis: Metrics and logs can be analyzed using Azure Monitor or Log Analytics.
- Respond: Alerts can be set up to trigger when specific conditions are met, for example, when a VM’s CPU reaches a critical threshold. VM scale sets and App Service scale events use this mechanism to add or remove instances based on these thresholds.
- Insights: Specific solutions are available for different sources, for example, Application Insights, Container Insights, and VM insights. Separate monitoring solutions can be installed that configure source-specific workbooks such as Azure SQL or Backup.
- Visualize: Logs and metrics can be viewed graphically using workbooks or dashboards, or even by integrating with Power BI.
- Integrate: Custom actions can be created in response to logs and metrics using Logic Apps.
The following diagram shows how all these features and sources come together as part of the Azure Monitor ecosystem:
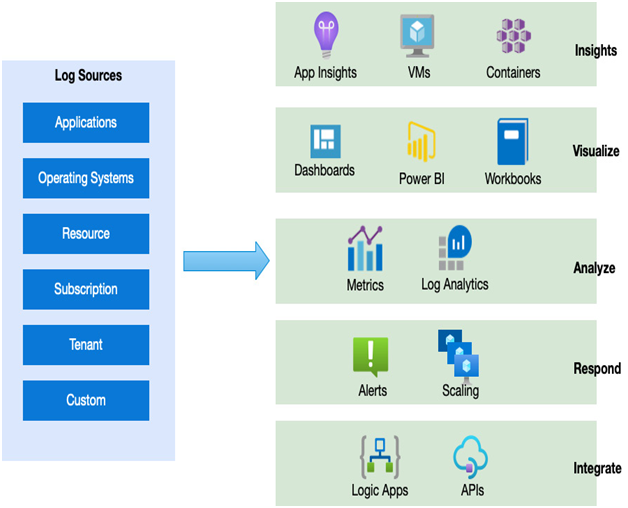
Figure 15.1 – Azure monitoring sources and actions

Leave a Reply